
A rolling ninety day window: June 1 through August 31, 2026. Inventory current as of September 18, 2026.
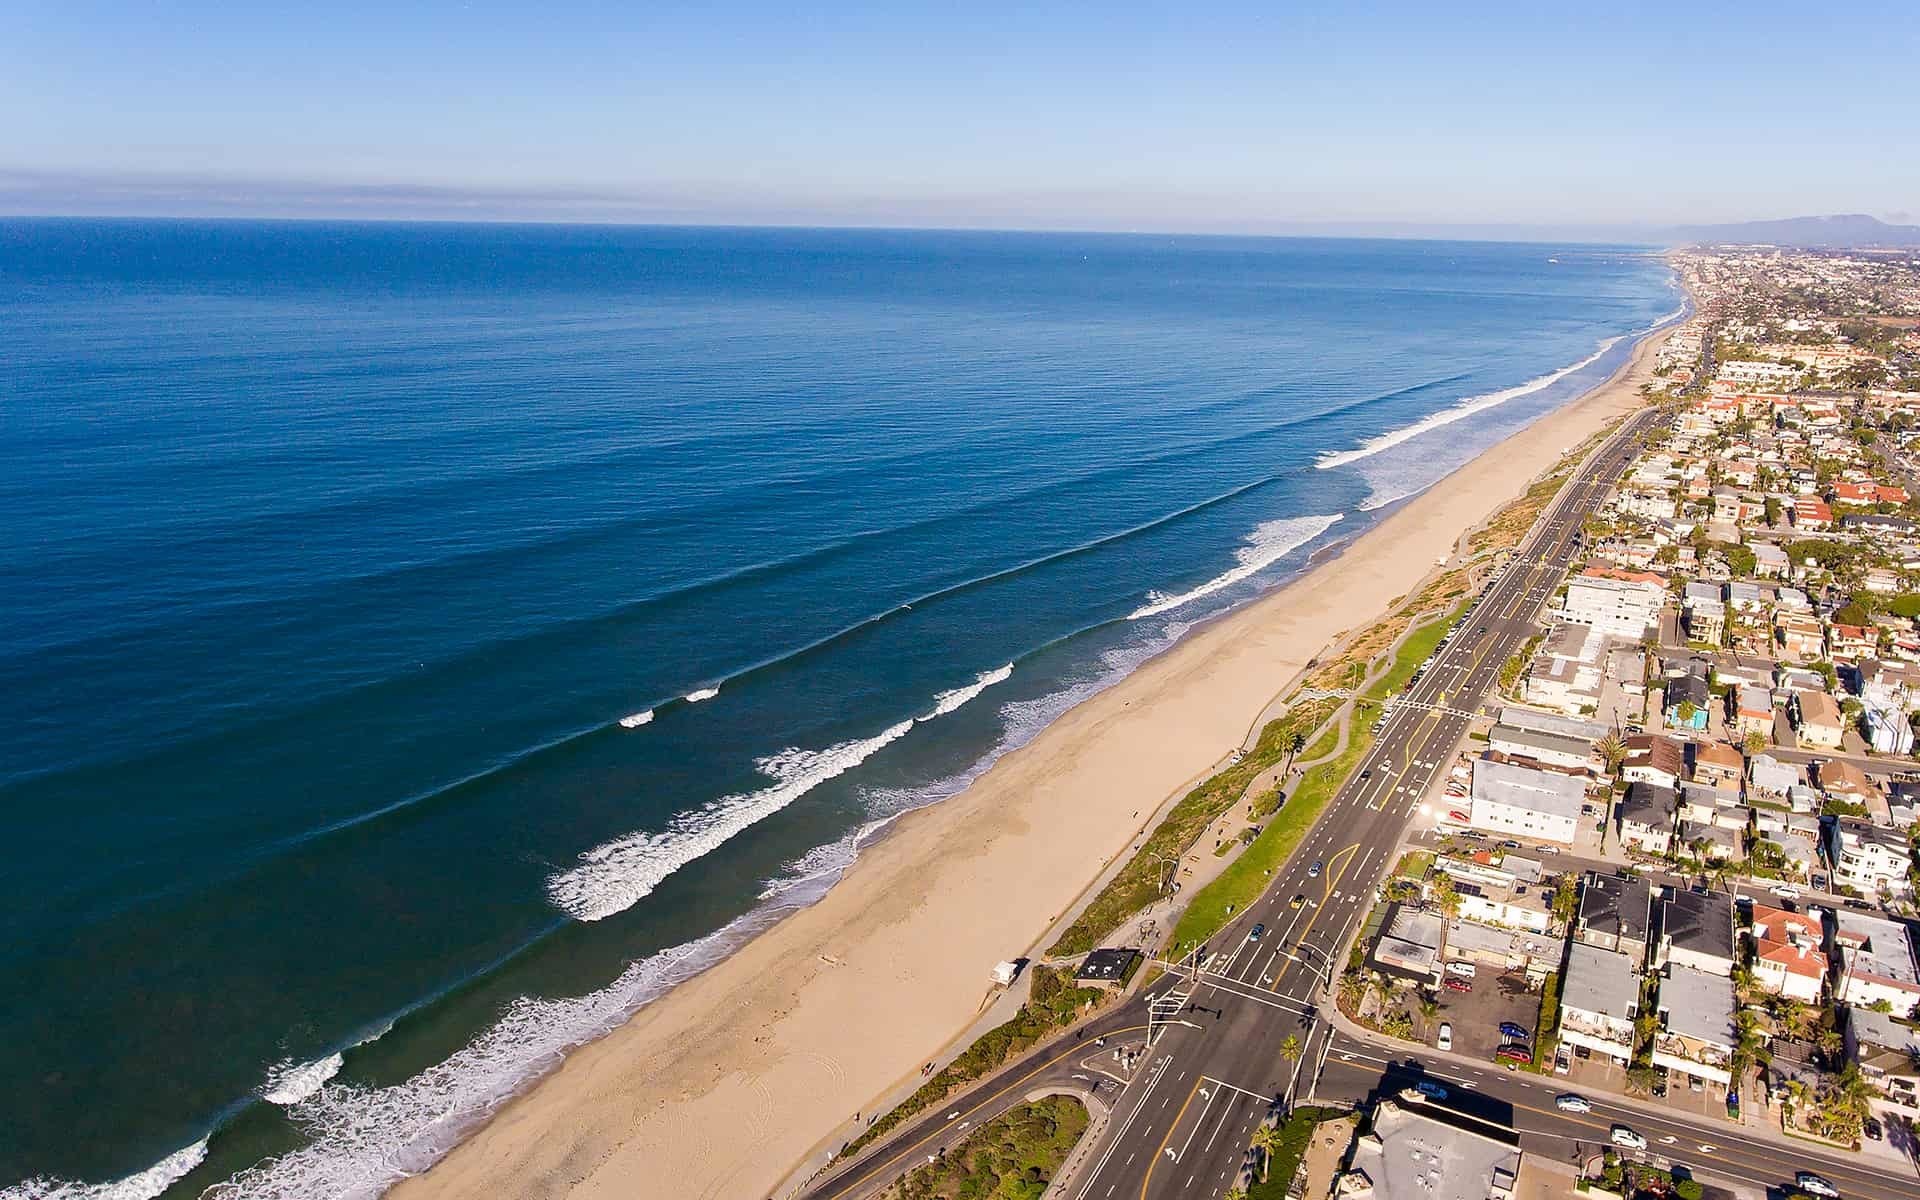
Carlsbad Village is the walkable core of the 92008 ZIP code near the coast and the train station. Roughly three quarters of what sells there is attached, condominiums and townhomes, and the closings over the past year span homes built from 1927 to 2026, so no two months hold quite the same mix.
How this is measured, before the numbers
These figures cover the three complete months from June 1 through August 31, 2026 rather than August on its own, and they are compared with the identical three months a year earlier. A single month in a market this size swings on a handful of closings, which makes it a poor guide to where prices actually are. The median is taken from the whole pool of 24 sales in the window, not averaged from three monthly medians. Of those 24 sales, 8 closed in August 2026.
June 1 through August 31, 2026 in numbers
All figures from the September 18, 2026 pull. Sales and inventory come from the same pull.
| Measure | June 1 through August 31, 2026 | June 1 through August 31, 2025 |
|---|---|---|
| Homes sold | 24 | 29 |
| Median price | $1,750,500 | $2,099,000 |
| Median price per square foot | $969 | $1,068 |
| Median days on market | 35 | 38 |
| Sale to list price | 98.6% | 98.9% |
| Percent of original asking price | 96.0% | 96.9% |
| Closed at or above asking | 33.3% | 41.4% |
| Took a price reduction | 33.3% | 41.4% |
The median across the window was $1,750,500, down 16.6 percent against the same three months a year earlier. Price per square foot was $969, down 9.3 percent. The two measures disagree, so the mix of homes that sold changed. Attached homes were 71 percent of the window's closings against 76 percent a year earlier, on a median 1,660 square feet against 1,795. Read the price per square foot as the measure of value and the median as a description of what happened to close.
Homes took a median 35 days on market across the window, against 38 days in the same three months a year earlier. Sellers collected a median 98.6 percent of their final asking price and 96.0 percent of their original.
Over the full twelve months through August 2026, the median across 103 sales was $1,888,227, up 24.0 percent against the twelve months before it. The ninety day window shows where the market has been lately; the twelve month figure shows the longer trend.
Inventory as of September 18, 2026
There were 22 homes for sale and 10 in escrow. Against a closing pace of 8.6 sales a month over the previous twelve months, that is 2.6 months of supply. That is still short of the six months usually called balanced, but it is enough choice that a buyer is not forced to decide in a day. Inventory is a point in time rather than a window, so this snapshot is dated and belongs to this post only.
What the numbers say
Sellers collected a median 96.0 percent of their original asking price and 33.3 percent of closings in the window had taken a reduction first. The opening price is where the outcome is being decided. Homes that start above the market are still selling, but later and for less than they would have.
The national rate backdrop
Nationally, the Freddie Mac thirty year fixed average barely moved through August, reading 6.69 percent on the sixth, 6.67 on the thirteenth, 6.65 on the twentieth and 6.66 on the twenty seventh. That is a four basis point range across the whole month. It is national context and not a reading of this market, and nothing above should be attributed to it.
Where to look next
Neighborhood pages for this market: Carlsbad Village, Carlsbad real estate, Olde Carlsbad.
The wider market, last month: What Sold in Carlsbad, July 2026.
Same month, other markets: Ocean Hills Country Club.
How these figures are put together
Every figure above is calculated from closed residential sales reported to the multiple listing service in Carlsbad Village, from the pull dated September 18, 2026. The window is the three complete calendar months from June 1 through August 31, 2026, compared with June 1 through August 31, 2025. Medians are pooled from the individual sales in the window rather than averaged from monthly figures, because an average of medians is not a median and one unusual sale moves an average. Where the same home closed twice on two listings, it is counted once. Sale to list price is against the final asking price; percent of original asking price is shown separately. Active listings, pending sales and months of supply are a snapshot from the same pull and are dated above.
These are recently closed sales in the area and are not represented as transactions of The Lund Team. This is not an appraisal, a valuation, or financial advice.
Based on information from California Regional Multiple Listing Service, Inc. as of September 18, 2026 and/or other sources. All data, including all measurements and calculations of area, is obtained from various sources and has not been, and will not be, verified by broker of MLS. All information should be independently reviewed and verified for accuracy. Properties may or may not be listed by the office/agent presenting the information.
Tyson Lund · Broker · DRE #01385039
The Lund Team, Inc. · DRE #01394870
Enjoy this blog post? Click here to subscribe for updates
Leave A Comment